People throw parties, fly balloons and eat lotsa cake. That’s great, and that should always be the case.
 |
| image from http://free-extras.com |
How about making money even with falling stocks?
Sounds great right?!
But is it really attainable? Is it really possible to earn even with stocks falling down?
The short answer is an all-caps lock bold font-18 YES. HAHA
How?
How?
Do you still recall it?
I gave a short glimpse about what Cost averaging is all about in this blog: The Easy Way of Investing – Peso Cost Averaging. It’s a good introduction of the method emphasizing its inherent simplicity and capacity.
But this time, let’s try to clear out all your other doubts about the method using a language very dear to me - Mathematics.
More precisely, we’ll unleash the great power of Cost averaging through exact figures and concrete graphs using real-world data.
To do this, we’ll use some of the slides from Citiseconline’s COL Investor Seminar Series “Investing in the Stock Market Today” and “COL Easy Investment Program”. You can download them from their site.
Cost Averaging Defined
First, let’s go back to defining what cost averaging is all about.
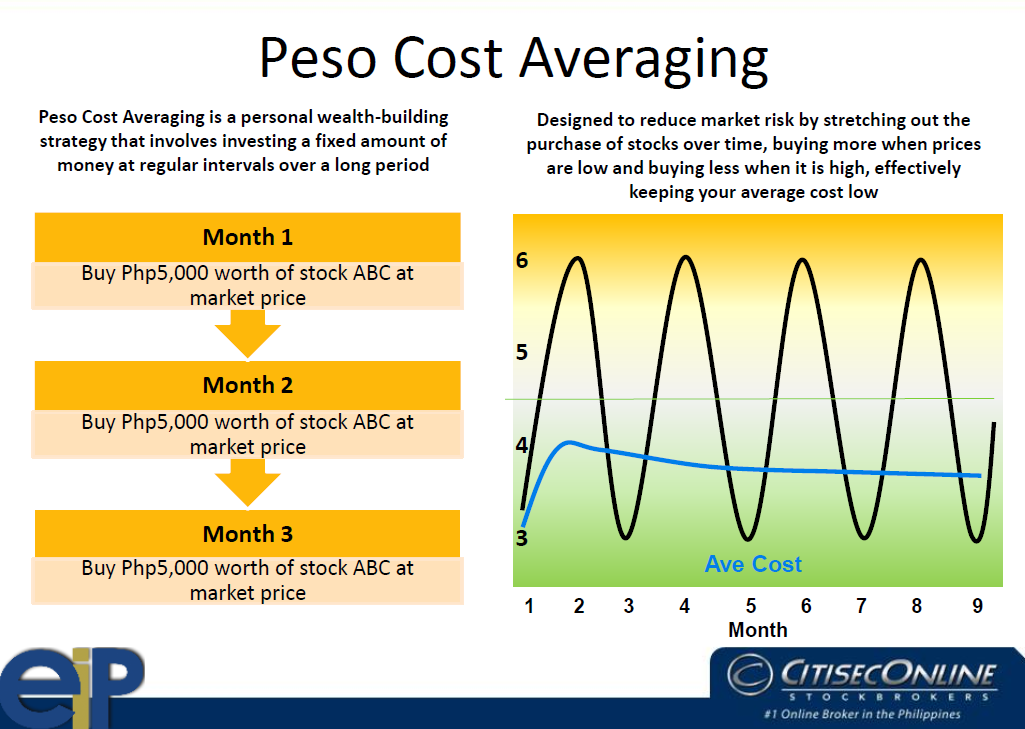
Cost averaging is simply an investment technique where the investor regularly purchases a stock (or stocks) at fixed intervals with set amount.
As such, it’s a very passive approach.
In the figure below, the fixed amount is set at 5000 and the fixed interval is per month. That means the investor is to buy his stocks (which must be strong and has great potential for growth) worth 5000 per month, consistently for a long time.
Since the stock market continuously goes through upward and downward motion with time, as depicted by the sinusoidal graph, that fixed amount 5ooo will be able to buy less shares when the market is up (when the prices are higher), but it will be able to buy more shares when the market is down (when the prices are lower). Do that habitually for months, and you’re effectively averaging down your average cost per share.

Does it work?
Does Cost Averaging really work? We’ll, let history tell!
But to do that, let’s add first to our vocabulary:
- Bull Market: The market is said to be a bull market when it’s going up. Its counterpart is a Bear Market when stocks are falling down. Obviously, we’re generally more happy whenever we have a market poised to have a bull run.
- Basket (or Equity Basket) is just a group of stocks as your stock portfolio. Imagine a literal fruit basket, with different fruits replaced with different stocks. Having a basket of stocks (versus having only one stock) is one form of protecting your investments through diversification.
- PHISIX stands for PSE (Philippine Stocks Exchange) Composite Index. It’s a general health status indicator of the stock market. Higher PHISIX means the market is generally going up. Market generally going down similarly drags down the PHISIX.
Additional assumptions:
1. Your basket consists of AC (Ayala Corp), BPI, MBT (Metrobank), SMC (San Miguel Corp) and TEL (PLDT). Your equity basket performance is then represented by the RED curve.
2. The data used were backtracked from their historical prices.
The stock market PHISIX is represented by the GREEN curve.
The performance of 91-Day T-bill, represented by the BLUE curve is also shown for comparison.
Now, time to examine what would happen in these two scenarios:
1. You started investing at the TOP of a bull market.
Let’s say you’re not lucky enough that you entered the market when it’s at the top of its bull run, i.e. when the prices are in its high. SAD L. That’s what happened in the Philippines from 1997-2007.
Since you started at the top (or end) of the bull market, you see the market PHISIX gong down for quite a long time. Then it only regained its confidence after around six years, when the market started to pick up again, and ultimately reached its original value.
In that span of 10 years, the market had gone down by almost 60% and only reached a maximum of 4.58% up at the end part of it. Quite not a good performance, you say so.
But lo and behold, if you had just continued investing and putting that fixed amount regularly to purchase for your basket, not minding the volatile movement of the market, the Peso Cost Averaging would still have given you more than 200% gain!
To compare, the T-bill only had 47% gain in the same period of time.
How about bank savings? Oh, better ask your banker, and see for yourself the bigger difference.

Now let’s examine a much desired scenario. What if you were born earlier and wiser enough to start investing from 1990-2007?
2. You started investing at the BEGINNING of a bull market. That is, you’re more than lucky that you were able to enter the market when it hit its bottom. PERFECT
What would happen?
With the stock market skyrocketing by 250% up from 1990-2007, your portfolio would have risen by more than 1800%Booooom!
Same plot of story but with a far better ending.
By contrast, T-Bill would have given you 150% gain.
You see, that’s the power of Cost Averaging; it works whether you’re at the top or at the beginning of the bull market. You just have to give it enough time to make it work for you.
Let’s talk with tables!
After graphs, let’s dig more using the dialect of tables. Shown below is a sample Cost Averaging activity, with the same message. The prices continue to fluctuate up and down, but with the strategy of constant purchasing of stocks, one can manage to maintain the average cost low.

BOTTOMLINE: The end result is that you’re able to keep your average price low, using a method designed to reduce market risk by purchasing stocks over time.
Another real world-based example
To have more realistic examples, I have shown the actual performance of the COL’s Original Six Easy Investment Program (EIP) premium stocks, leveraging on the same Peso Cost Averaging technique.
The only assumption is that you fully invest Php 5,000 every month for 33 months, starting from EIP launch date Aug 2008 up to April 2011.
The resulting annual yield speaks itself for the method!

FINAL NOTE
As a final note, have you noticed that even with TEL stocks falling down from Php 2490 to Php 2466, that portfolio component even contributed an 11.% gain in its entire duration?
Still the power of Peso Cost Averaging!
Friends, you too can do that!
Earn even with falling stocks!
Have fun investing!
PS1: For those who don't like figures and graphs, you can instead read this easy-to-read-book "My Maid Invests in the Stock Market, and Why You Should Too".
Download for free! :)
